Examining the changes in body composition over time
Readers of this blog will be familiar with terms such as “Lean Body Mass” (LBM) and “Fat Mass” (FM). Readers will also be familiar with how many studies on exercise and nutrition use measurements of LBM/FM as determinants of whether a training program or diet was successful or not.
Our next question should be, exactly how were LBM/FM affected?
Studies abound that show a relationship between long term health based on where we store fat on our bodies. If FM is lost in a study, how is it lost? Was most of the FM lost around the waist and torso, which has been shown to relate to poor long term health outcomes (see here, here, or here)? Was the FM just below the skin or was it marbled throughout the internal organs? Marbled FM has also been shown to be related to poor health outcomes (see here, for example).
What about LBM? Do we mean bone mineral content (BMC), muscle tissue, water, and/or organs? When participants gain 3 lbs of LBM, for example, what kind of LBM was it? Was it inches on the arms or just a lil overall?
I even dare ask, what are the differences between the males and females? Do they carry their LBM/FM differently? Do these training programs and diets result in different regional changes based on sex? A program that produces great results for females may not be noticeable for males if the distributions of LBM/FM are different across their bodies.
The researchers of today’s study attempted to get at a couple of these questions. To quote them, “Meaningful information can be obtained from consideration of regional body composition changes rather than whole body changes alone.“ The study was published in 2000 and is titled, Regional body composition changes in women after 6 months of periodized physical training.
Methods
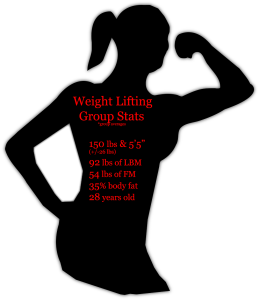
To get at this issue, these researchers utilized both DEXA scans and MRI scans before/after 24 weeks of training. The participants were 31 females. The researchers also scanned a control group of 5 females before/after, who did not do any training. Below are the descriptive stats for the lifting group. The control group’s stats were the same. As always, they’re group averages and rounded to the nearest whole number for the ease of viewing.
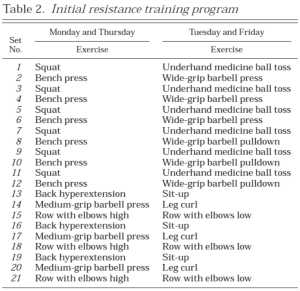
The participants trained 5 days a week. Four days a week they did 50 minutes of lifting followed by 30 minutes of cardio. All of that was done with the study trainers. The cardio was varied from day to day. The 5th day of exercise was more cardio. Because of the connection between this research team and the military, the program was similar to military type work. The outline for the lifting portion of the program is below, taken straight from the paper. Weights were increased over time, with rep counts varying over the life of the study.
To be clear, this study was an examination of body composition and the effects of weight lifting on that. Thus, the participants were not put on a diet or told to change their normal eating pattern.
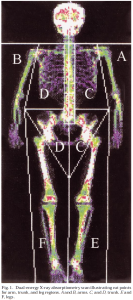
For the DEXA scans, the researchers evaluated FM, bone, and non-bone LBM. They quantified amounts and distributions across the bodies, as well as how those changed over time with training. Here is a video of some scan results that provides a visual example. Below is one example of the DEXA scan results from this study.
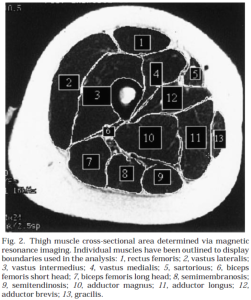
MRI scans of the thighs were taken and the tissues were quantified in the same way. Those results were compared to the results of the DEXA scans, in order to test the agreement between the two methods of measurement. Below is one example of one of the MRI scan results.
Results
The training resulted in gainz and losses. The training participants gained an average of 1.5 lbs of LBM, overall. They also lost an average of 6 lbs of FM, overall. Their bone density, however, did not change during the 24 weeks of training. There was no change overall or in specific spots.
The LBM gainz were entirely in the legs and split equally between the left and right legs.
The total mass of the bone tissue (that did not change) was 4 lbs.
The FM results were very interesting. Three of the lbs lost were from around the torso and the other 3 lbs lost were from the arms. Each arm lost an equal 1.5 lbs. As a percent, the arms lost 32% of their FM. The legs didn’t lose any fat over the 24 weeks.
The MRI results correlated highly with the DEXA results. Both agreed on the results of the training program.
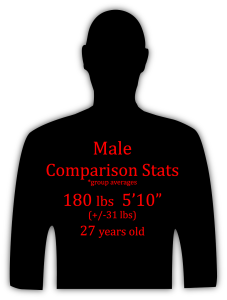
As a bonus, the researchers scanned a control group of 18 males and compared their mass breakdown/distribution to the females’. The males had more BMC/LBM overall and at every part. The males had less FM overall and at every part, also. Their average group stats are listed below.
Thoughts / Implications
While this study did not get into all of the details that the introduction showcased, this was still a nice step into the kind of analyses that DEXA scans offer.
The males and females had one composition commonality. Their legs held the most FM.
I will not deny that I was surprised and a little saddened that the participants did not increase their bone mineral density/mass. In the coming months, I will be looking at more studies that examine BMC and we will hopefully get to the bottom of how training affects that.
The Nitty Gritty
The results of the changes in FM distribution highlights the differences between “hard” metrics and “soft” metrics to measure our training progress. Allow me to use the results of this study to explain. The scale changed by an average of -4.5 lbs. That “hard” but blunt metric obscures the more precise results of 6 lbs FM lost and 1.5 lbs LBM gained. When the participants looked in the mirror, they had a striking “soft” metric reflecting back. Their overall body fat % dropped from 34.5% to 31.8%, which is actually a meaningless statement. Precisely, their arms lost 32% of their FM! Their waists had the same experience! After the study, their arms and waists had not gained any muscle but they looked like they had. They appeared leaner and by anyone’s judgment they had gotten more muscular. This “soft” metric result highlights how we can get the appearance of muscularity by revealing the muscles we already have.
Plain & Simply
Folks love to throw around body fat % numbers when the truth is that body fat % alone is meaningless. Overall body fat level looks very different on each person depending on a number of factors. Is most of that 25% in the arms, legs, or waist of each person? As I said in the intro, that matters when it comes to health. It also matters when it comes to our “look.” Two people of the same body fat % can have very different looks depending on where they hold that fat, before/after weight loss.
Use caution when throwing numbers around. Understand that they mean different things to different people. Like snowflakes, we may be made of the same things but each of our patterns are unique.
If you have any questions about this study or anything I said, please feel free to leave a comment. I will get back to you and others may have insight to offer, too. If you have any questions or topic suggestions that you would like answered as a post, then please email me at robert@analyticfitness.com.
Don’t forget to like Analytic Fitness on Facebook, or follow me on Twitter or the other social medias!



No Responses